Page 1 of 1
Frequency response graph
Posted: Sun Sep 04, 2011 3:44 pm
by abl385
Where can I find (or somehow generate?) such a graph for my KRK Rokit 5s?

Re: Frequency response graph
Posted: Mon Sep 05, 2011 2:11 pm
by abl385
And that because I want to know what the curve looks like below 53 Hz. Like how steep it is.
Re: Frequency response graph
Posted: Mon Sep 05, 2011 4:57 pm
by 3dot...
the krks manual/site ?

Re: Frequency response graph
Posted: Mon Sep 05, 2011 5:49 pm
by abl385
No.. the only thing they say about the frequency response is this: 53Hz - 20kHz (+/- 2 dB). But I'd like to know in a little more detail what's happening below 53Hz..
Re: Frequency response graph
Posted: Mon Sep 05, 2011 6:29 pm
by ikeaboy
If the manufacturer didn't release a more detailed graph then I doubt you'll find one unless someone like sound on sound di in a review and I doubt they would. Since you mention generating a graph I'll assume you own a pair so why not sweep a sine tone down there with Operator in single oscillator fixed frequency mode? should give you a good idea but no graph.
Re: Frequency response graph
Posted: Tue Sep 06, 2011 8:46 pm
by abl385
There weren't any graphs on SOS indeed. I'll try the sine trick though, thanks!
Re: Frequency response graph
Posted: Tue Sep 06, 2011 9:12 pm
by memes_33
yeah, those curves cost money to make. they have to run audio through it in an anechoic chamber to get those results. manuals sometimes have more graphs & technical specs, but i'm guessing you've checked there.
Re: Frequency response graph
Posted: Tue Sep 06, 2011 9:36 pm
by abl385
Interesting to know how they generate the curves! And no, unfortunately the manual contains no graphs.. only words

Re: Frequency response graph
Posted: Tue Sep 06, 2011 9:47 pm
by shuutobi
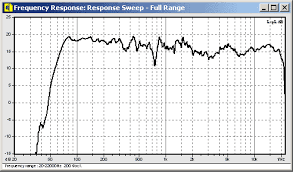
Supposedly this is the KRK Rockit 5 frequency response plot:
 http://www.tomshardware.com/forum/54967 ... l-speakers
edit: the 0dB point has to be off heh.
Re: Frequency response graph
Posted: Tue Sep 06, 2011 10:55 pm
by abl385
Good find shuutobi, thanks. Though I have to complain a little: this is showing that the low cut takes place at around 80Hz, why do they say 53Hz? (Basically this is for G1 and I own a pair of G2s but I don't think this would make much difference anyway.)
The thing is I made a couple of tracks with the KRKs and one of them I played back in my car... and it almost exploded. The tremor was so bad I couldn't find the stop button. Guess I couldn't hear the low frequencies very well, so I kept boosting the bass

In my defence I only bought them recently, thus I haven't practiced mixing on them a lot but...
Would a sub be a necessity with such a "poor" low frequency response or is it my ears simply need some more time to adjust?
Re: Frequency response graph
Posted: Tue Oct 18, 2011 4:06 pm
by Da hand
I use
Room EQ Wizard to do my room/speaker measurements. It is free software (but believe me it is very professional) and all you need is a test mic - like the Behringer ECM8000 (which costs only $50)
This way you will get the frequency responses for your speakers, room, sweet spot, etc (depending on how you do your measurements).
Re: Frequency response graph
Posted: Tue Oct 18, 2011 8:35 pm
by memes_33
abl385 wrote:Good find shuutobi, thanks. Though I have to complain a little: this is showing that the low cut takes place at around 80Hz, why do they say 53Hz? (Basically this is for G1 and I own a pair of G2s but I don't think this would make much difference anyway.)
The thing is I made a couple of tracks with the KRKs and one of them I played back in my car... and it almost exploded. The tremor was so bad I couldn't find the stop button. Guess I couldn't hear the low frequencies very well, so I kept boosting the bass
In my defence I only bought them recently, thus I haven't practiced mixing on them a lot but...
Would a sub be a necessity with such a "poor" low frequency response or is it my ears simply need some more time to adjust?
manufacturers are sometimes vague with frequency response numbers- they can say "50Hz - 20kHz", but without a plus/minus number behind it, its sort of hard to decipher. for example, it could be 50-20k plus/minus 3 dB or plus/minus 12 dB. the good manufacturers with give you that +/- number (not to dis KRK, but they are marketing to the pro-sumer market, which is much more forgivable)
on the 2nd point, you rooms acoustics might have as much to do with the lack of bass presence as your monitors do. bass frequencies are notorious for canceling themselves out in small rooms, especially with parallel walls and no acoustical absorption. do you have bass traps? spending $200 or $300 on some decent bass traps (or making your own) can really tame these issues. check out GIK acoustics- cheap and well made bass traps.
having great monitors means very little if you don't have a decent room to listen to them in.
Re: Frequency response graph
Posted: Tue Oct 18, 2011 9:15 pm
by spacecat
+1 for room eq wizard.. changed my game !

Re: Frequency response graph
Posted: Tue Oct 18, 2011 9:32 pm
by psyfi
The main problem with the graphs provided by manufacturers in their manuals are they are made to look falter than they might be by lowering the resolution of the graph to give a gentler falter looking response curve.
My advice would be that you need to get use to any set of monitors before your knocking out mixes at your usual or better standard and that adding a sub woofer might help it will also bring with it it's only dilemmas of placement and volume setting crossover and so on. No one said it was going to be easy but the human brain is va very clever thing and you it can learn to adjust for most things. Also look at your mixing environment and if any acoustic treatment is needed to accommodate the new monitors.
I use NS-10s which don't feature the same kind of bass response that most modern monitors do but I still find I can trust what.s happening down there and not having all that bass in my face really opens up the rest of the mix for inspection.